New CAT26: faster surfaces, surface area, new QC

Computational Anatomy Toolbox for SPM

Voxels, surfaces and regions. One toolbox.

CAT turns T1-weighted MRI scans into gray-matter maps, cortical surfaces with thickness and folding measures, and atlas-based regional values. It is fully automated, with quality control and statistics built in.

  • Free & open source (GPL)
  • Windows, macOS & Linux
  • With MATLAB or standalone
  • BIDS & parallel processing
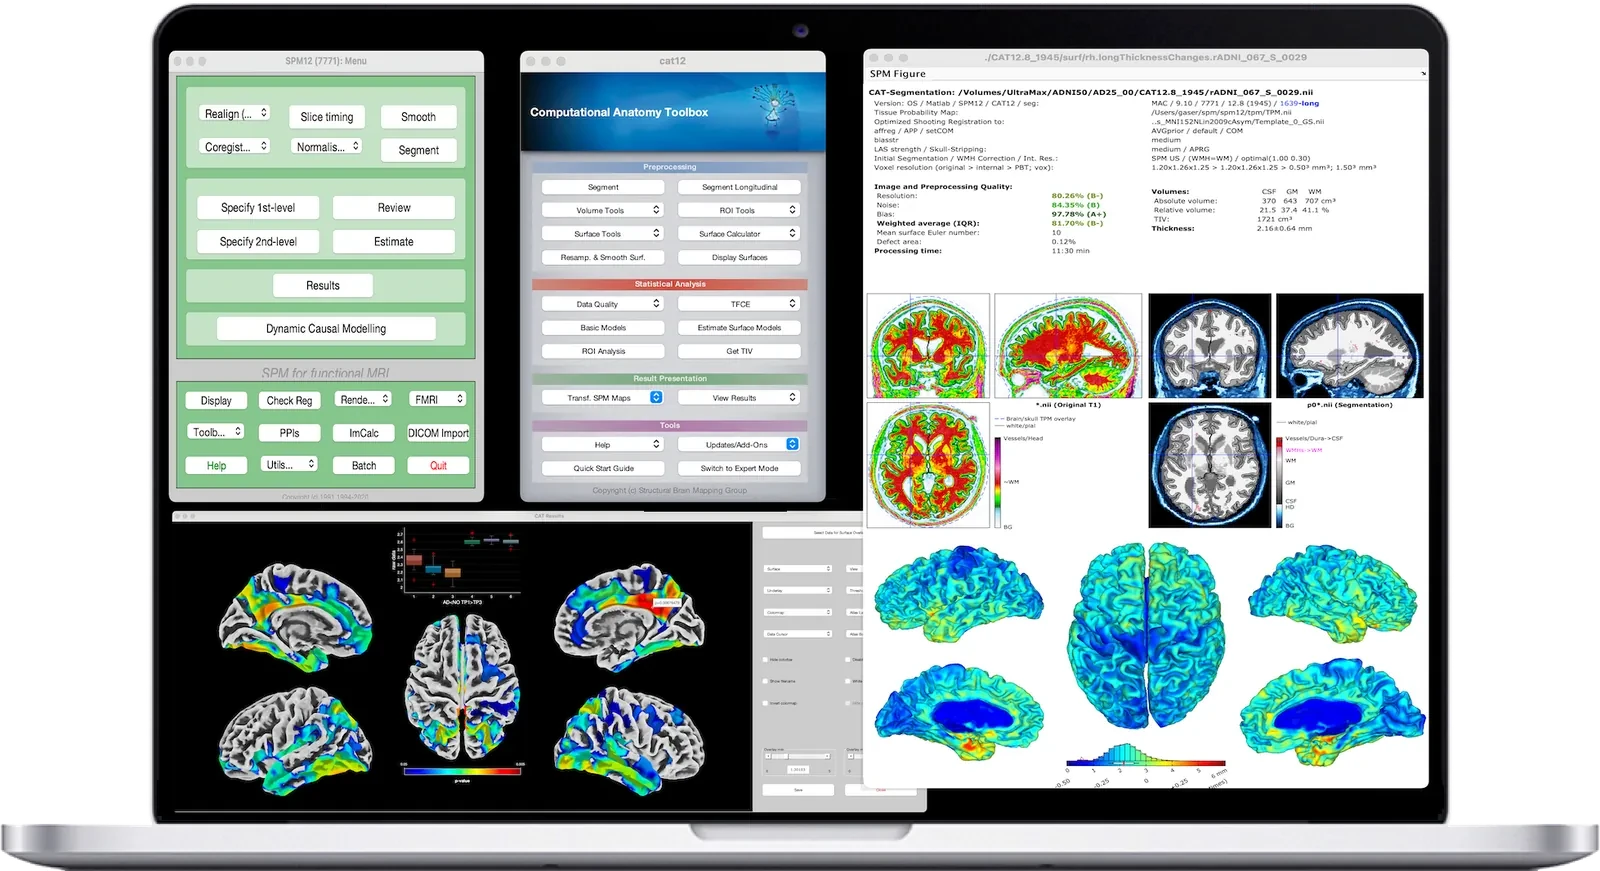
CAT running in SPM: the CAT menu, a single-subject report with quality ratings and tissue segmentation, and cortical thickness results on brain surfaces

Analyses

One scan, one run, many ways to analyze it

A single preprocessing run gives you voxel-, surface- and region-based data. All of it comes from the same tissue segmentation, so your results are consistent across methods.

Input T1-weighted MRI Single scans, longitudinal series or BIDS datasets
CAT One automated run
  • Denoising
  • Segmentation
  • Registration
  • Surface reconstruction
  • Quality rating

Voxel-based morphometry

Map gray and white matter, voxel by voxel

CAT segments each brain into gray matter, white matter and CSF with partial-volume precision, then registers it to MNI space with Dartel or Geodesic Shooting. Ready-made templates from 555 healthy subjects mean you don’t need study-specific templates for most studies.

  • Modulated tissue maps, ready for statistics in SPM
  • Total intracranial volume (TIV) and global tissue volumes
  • Longitudinal models for plasticity, aging and development
VBM in the manual
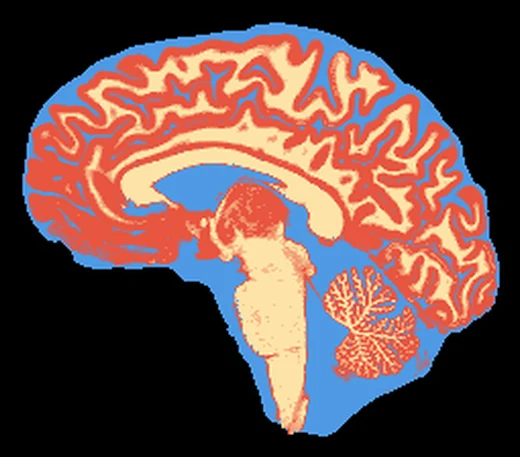
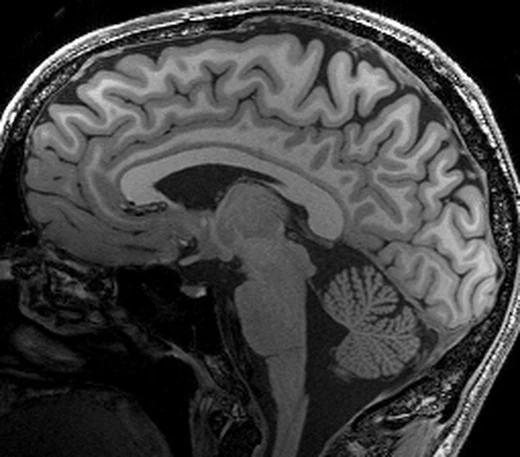
Sagittal T1-weighted MRI of one subject
T1 image
Tissue label map of the same slice: CSF in blue, gray matter in red-orange and white matter in cream, blended where a voxel holds two tissues
Label map
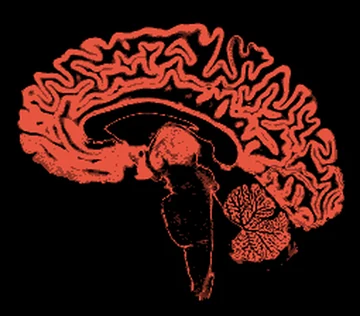
Gray matter map of the same slice
Gray matter
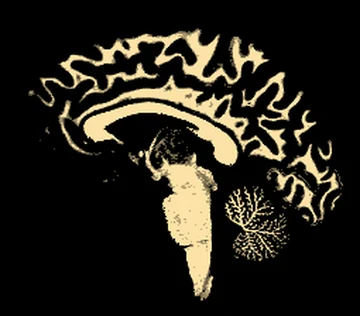
White matter map of the same slice
White matter
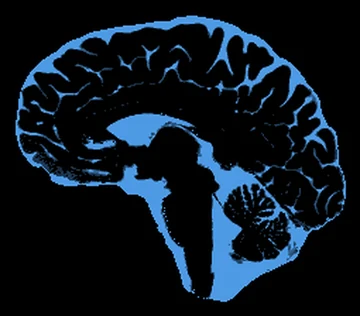
CSF map of the same slice
CSF

Surface-based morphometry

Cortical thickness and folding, fully automated

CAT reconstructs the central cortical surface and measures thickness in one step, directly from the tissue segmentation (projection-based thickness). No manual editing is needed. In CAT26, the surface pipeline is faster and creates topology-correct surfaces from the start.

  • Cortical thickness
  • Folding: gyrification, sulcal depth and cortical complexity (fractal dimension)
  • New Surface area
  • Spherical registration to standard 164k or 32k (HCP) meshes for group statistics
Surface analysis in the manual
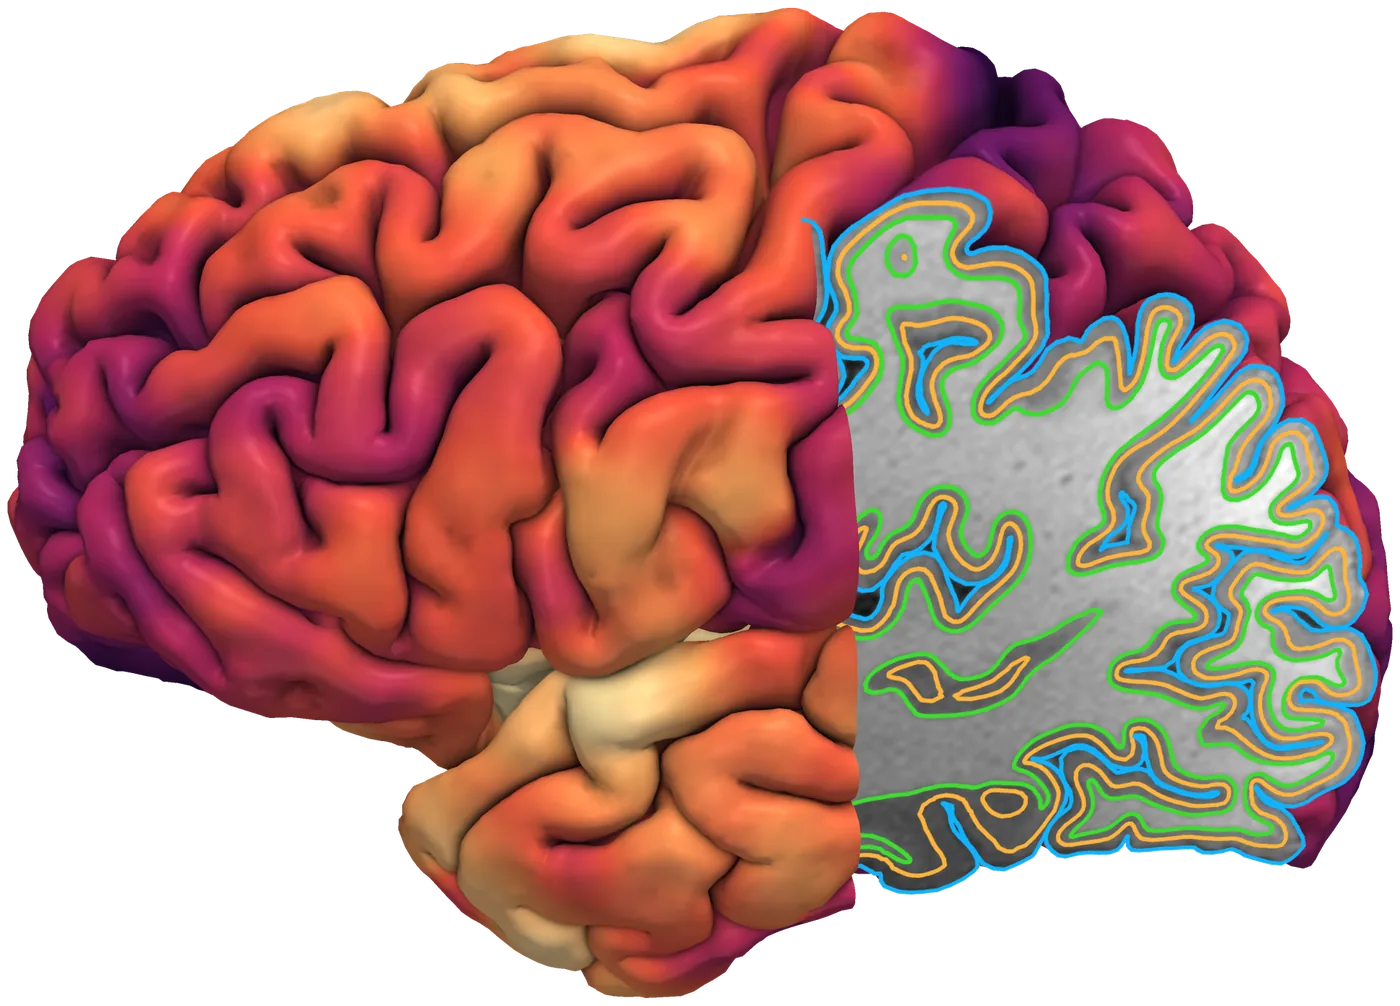
Cortical thickness in color on the left hemisphere. The back half is cut open along a sagittal T1-weighted slice that shows the pial, central and white matter surfaces reconstructed by CAT.
Cortical thickness 1.83.6 mm pial surfacecentral surfacewhite matter surface
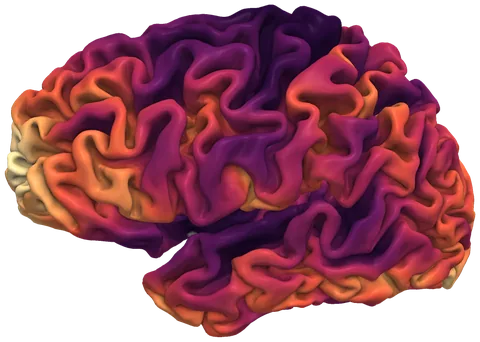
Gyrification
Gyrification on the left hemisphere

lowhigh

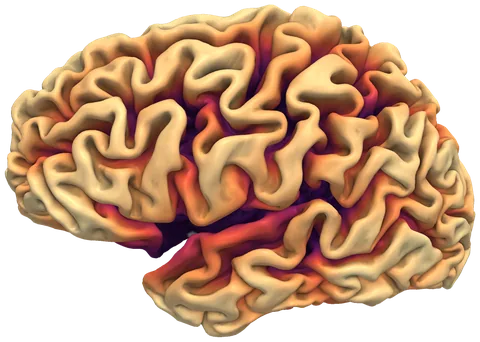
Sulcal depth
Sulcal depth on the left hemisphere, deep sulci dark

deepshallow

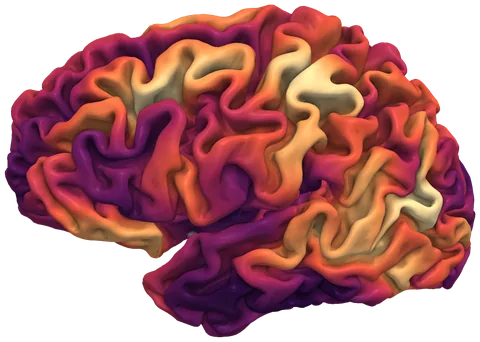
Cortical complexity
Cortical complexity (fractal dimension) on the left hemisphere

lowhigh

Surface mapping

Bring fMRI and other volume data to the cortex

Map fMRI contrasts or any other volume data, such as myelin-sensitive or quantitative maps, onto each subject’s own cortical surface and benefit from surface-based smoothing and registration. Results that are already in MNI space can be projected onto the template surface.

  • Sampling at chosen cortical depths (equi-distance or equi-volume)
  • The same surface statistics and displays as for thickness
  • Show VBM results on the cortical surface, too
Surface mapping in the manual
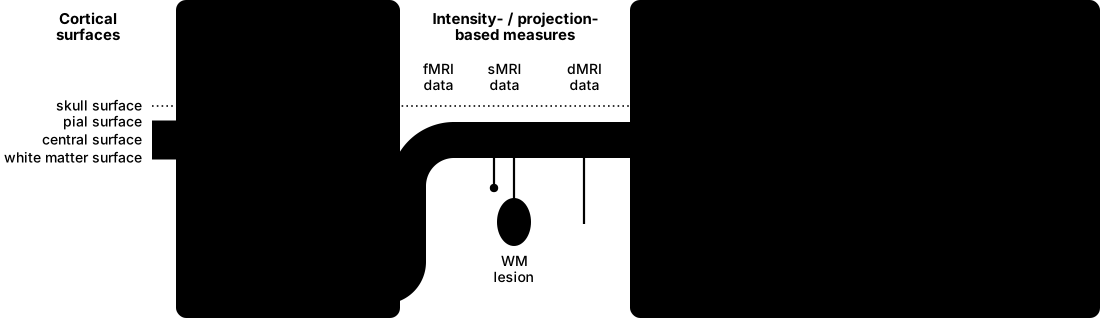
Schematic of the cortical ribbon with the skull, pial, central and white matter surfaces, and the measures CAT derives: gray matter thickness, area and volume, CSF and white matter volume; values sampled from fMRI, structural and diffusion MRI, including a white matter lesion; and folding measures: curvature of gyri and sulci, sulcal depth to the convex hull, and the area relation of the folded and unfolded surface
Measures on and around the cortical surface: thickness and area, values sampled from fMRI, structural or diffusion data, and folding.

Region-based morphometry

Regional values from volume and surface atlases

Atlases are mapped to each brain through CAT’s spatial registration. For every subject, you get regional tissue volumes and regional surface values (thickness, folding or mapped data), ready to export as CSV.

Volume atlases

  • Neuromorphometrics
  • LPBA40
  • Hammers
  • AAL3
  • CoBrA
  • IBSR
  • Mori
  • Anatomy 3
  • Julich-Brain 3
  • Schaefer 100–600
  • Tian subcortex
  • Thalamus
  • Thalamic nuclei
  • Hypothalamus
  • SUIT cerebellum

Surface atlases

  • Desikan-Killiany
  • Destrieux
  • HCP-MMP1
  • Julich-Brain 3.1
  • Schaefer 100–600
ROI analysis in the manual
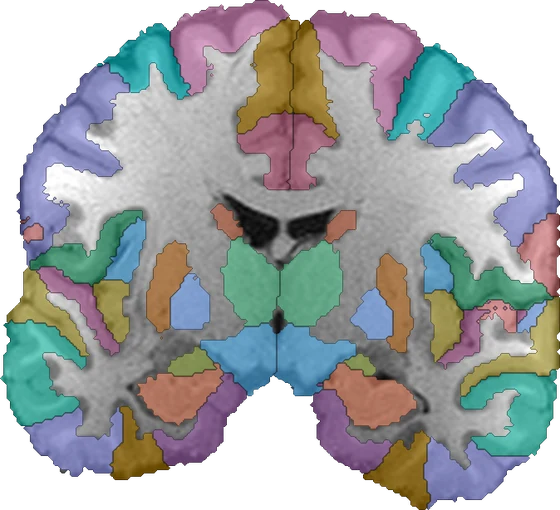
Volume atlasNeuromorphometrics
Coronal T1-weighted slice of one subject with the gray matter regions of the Neuromorphometrics atlas, mapped into the subject’s native space
Left regionGray matter
Hippocampus3.46 ml
Putamen4.19 ml
Superior temporal7.20 ml
Surface atlasDesikan-Killiany
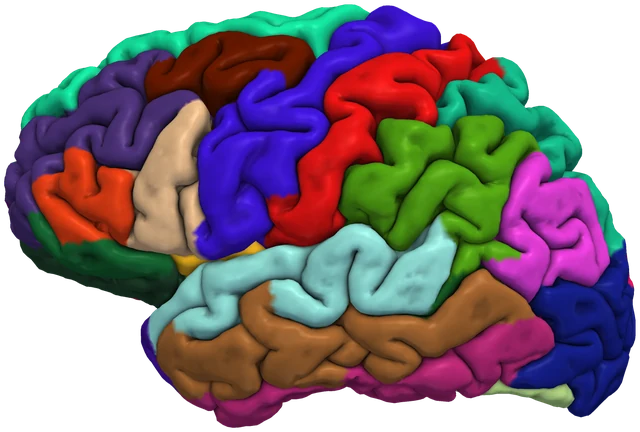
Left hemisphere of the same subject with the regions of the Desikan-Killiany atlas on its cortical surface
Left regionThickness
Precentral2.58 mm
Postcentral2.34 mm
Superior temporal2.92 mm
Two atlases mapped into the native space of one subject through CAT’s registration, with some of the regional values CAT writes for it.

Quality control

Know your data quality before you analyze it

Every scan gets a one-page report with tissue volumes, surface measures and image-quality ratings. Noise, bias and resolution are combined into one grade from A (excellent) to F (failed) that you can compare across scanners, sequences and sites.

  • Automatic quality rating (SIQR) for every scan
  • Sample homogeneity check flags outliers before statistics
  • Built for multi-site and large-scale studies
Quality control in the manual
CAT quality ratings: rating points from 100 to 0, a linear scale from 0.5 to 10.5 and letter grades from A+ (excellent) to F (unacceptable or failed). Example scans of good, bad and ugly quality point to their ratings, and box plots compare the SIQR and the relative gray matter volume of the three groups.
One scale from A+ (excellent) to F (failed): example scans of good, bad and ugly quality, and how their SIQR and relative gray matter volume differ.

Approach

One segmentation, many measures

Voxel-based and surface-based analyses are often carried out with separate software packages, each with its own segmentation, registration, coordinate space and quality checks. Combining their results means reconciling different processing streams.

CAT is built around a single processing stream instead. Gray-matter maps, cortical surfaces and regional values are all derived from the same tissue segmentation within one automated run, so voxel-, surface- and region-based results can be compared directly.

The methods are described in detail in Gaser et al. (2024), GigaScience.

  1. Consistent across methods

    Gray-matter maps, cortical surfaces and regional values all come from one segmentation with partial-volume estimation, so volumes, surfaces and atlas regions refer to the same delineation of the cortex.

  2. Surfaces without manual editing

    Cortical thickness and the central surface are estimated in one step from the segmentation (projection-based thickness), and topological defects are corrected automatically. Surface reconstruction is part of the same run, not a separate processing stream.

  3. Quality is measured, not assumed

    Every scan is rated for noise, bias and resolution on a common scale from A to F. A sample homogeneity check identifies outliers before the statistical analysis.

  4. Robust for real-world data

    Denoising, local adaptive segmentation and partial-volume estimation handle noise, intensity inhomogeneities and challenging sequences such as MP2RAGE. Longitudinal models are tailored to plasticity, aging and development.

  5. Statistics within SPM

    Voxel- and surface-based models are set up and estimated in SPM, with threshold-free cluster enhancement (TFCE) and display of results on slices or on the cortical surface.

  6. Open and portable

    CAT is free software under the GNU GPL. It runs on Windows, macOS and Linux, from the GUI, in batch mode or from the command line, with MATLAB or as a standalone version without a license. BIDS input and parallel processing support large cohorts, and a standardized ENIGMA protocol is available.

Workflow

From scans to results in four steps

  1. Install

    Copy CAT into SPM’s toolbox folder, or use the standalone version without MATLAB.

  2. Preprocess

    Select your T1 images or a BIDS dataset and run Segment. CAT processes subjects in parallel.

  3. Check quality

    Review each scan’s report and rating, and check sample homogeneity to catch outliers.

  4. Analyze

    Run voxel-, surface- or ROI-based statistics and show results on slices or on the cortical surface.

Under the hood: the preprocessing pipeline
CAT processing pipeline: initial voxel-based processing, refined voxel-based processing, and surface-based processing
Denoising
Spatially adaptive non-local means filter (Manjón et al. 2010) and a Markov random field within the segmentation (Rajapakse et al. 1997).
Intensity correction
Affine preprocessing (APP) and local adaptive segmentation (LAS) correct bias and regional intensity variations, e.g. in motor cortex or basal ganglia.
Segmentation
Adaptive maximum a posteriori (AMAP) estimation (Rajapakse et al. 1997) with partial-volume estimation (Tohka et al. 2004) and graph-cut skull-stripping.
Registration
Dartel (Ashburner 2007) or Geodesic Shooting (Ashburner 2011) to templates in MNI152NLin2009cAsym space.
Surfaces
Projection-based thickness (Dahnke et al. 2012), topology correction (Yotter et al. 2011a), spherical mapping (Yotter et al. 2011b) and spherical registration (Yotter et al. 2011d).
Folding measures
Gyrification via absolute mean curvature (Luders et al. 2006), sulcal depth, and cortical complexity via fractal dimension (Yotter et al. 2011c).
Quality assessment
Ratings for noise, bias and resolution (Dahnke et al. 2025).

What’s new

CAT26

Released October 2026. CAT now uses year-based version numbers, and the toolbox folder inside spm/toolbox is now called CAT.

Faster, more robust surfaces

An improved marching-cubes reconstruction creates topology-correct surfaces directly, for faster processing and more robust thickness estimates.

Surface area

The much-requested per-vertex surface area is now available as an additional measure in Extract Additional Surface Parameters.

More robust VBM

A comprehensively updated volume pipeline with more accurate affine registration, especially for challenging acquisitions such as MP2RAGE.

Updated quality metrics

The quality assessment now follows Dahnke et al. 2025, and the former IQR rating is replaced by SIQR.

New volume tools

Average rescans, e.g. to reduce motion artifacts, and run image calculations on many subjects at once, e.g. for T1w/T2w ratios.

Searchable manual

Find options and methods quickly with the new search in the online manual.

Full release notes

Cite

How to cite CAT

If you use CAT in your work, please cite the main reference:

Gaser C, Dahnke R, Thompson PM, Kurth F, Luders E, Alzheimer’s Disease Neuroimaging Initiative (2024). CAT: a computational anatomy toolbox for the analysis of structural MRI data. GigaScience 13, giae049. https://doi.org/10.1093/gigascience/giae049
Show BibTeX
@article{Gaser2024CAT,
  author  = {Gaser, Christian and Dahnke, Robert and Thompson, Paul M. and
             Kurth, Florian and Luders, Eileen and
             {Alzheimer's Disease Neuroimaging Initiative}},
  title   = {{CAT}: a computational anatomy toolbox for the analysis
             of structural {MRI} data},
  journal = {GigaScience},
  volume  = {13},
  pages   = {giae049},
  year    = {2024},
  doi     = {10.1093/gigascience/giae049}
}

Please also cite the methods you use. The references are listed in the pipeline overview above and in the manual.

Download

Get CAT26

Free for the scientific community under the GNU General Public License.

For MATLAB users

Install CAT as an SPM toolbox to use every feature, including parallel processing and the interactive GUI.

Download CAT26

Requirements

  • SPM12 or newer
  • MATLAB R2020a or newer (Windows: R2022a, Apple Silicon: R2023b)
  • No additional MATLAB toolboxes

Installation

  1. Remove any old cat12 or CAT folder from spm/toolbox.
  2. Unzip the download and copy the CAT folder into spm/toolbox.
  3. Restart SPM and open CAT from the Toolbox menu, or type CAT in the MATLAB command window.
  4. Later, use CAT’s built-in update function to check for new versions.

Standalone, no MATLAB license

Runs with the free MATLAB Runtime R2023b (v232) and is mainly intended for scripted, headless use on servers and clusters. Some features, such as parallelization and the interactive help, are not available.

SystemCAT26MATLAB Runtime
LinuxDownloadR2023b
macOS (Intel)DownloadR2023b
macOS (Apple Silicon)DownloadR2023b
WindowsDownloadR2023b

Examples for calling CAT from shell scripts: standalone guide.

Older versions: GitHub releases · CAT12.9 and earlier · Developer version: GitHub · Need another build? Contact us